Are you trying to decipher the complex world of statistics? Well, you’ve come to the right place! In this article, we’ll break down the basics of population and sample in statistics, complete with examples and visual aids. These two foundational concepts are crucial for data analysis, and understanding them will help you make more accurate and effective decisions based on your data.
What is a Population in Statistics?
In statistics, a population refers to the entire set of individuals or items that you want to study. The population encompasses all possible observations that you can make.
For example:
- If you are interested in the average age of all doctors in a hospital, then the population is all the doctors in that hospital.
- If you want to know the average weight of all apples produced in a certain orchard, then every apple in that orchard makes up your population.
- If you want to investigate the proportion of voters who support a particular candidate in a city, then all the voters in that city constitute your population.
What is a Sample in Statistics?
A sample, on the other hand, is a subset of the population. It’s a smaller group that has been selected from the population. Samples are used in statistical analysis because it’s often impractical or impossible to collect data from the entire population. Here are a few examples:
- If you are interested in the average age of doctors in a hospital, you might randomly select a group of 50 doctors out of several hundred. This group of 50 doctors is your sample.
- If you want to know the average weight of apples from an orchard, you might randomly select 100 apples out of thousands. These 100 apples represent your sample.
- If you want to investigate the proportion of voters who support a particular candidate in a city, you might conduct a survey of 1,000 voters. These 1,000 voters make up your sample.
Population vs Sample: Spotting the Differences
The main difference between a population and a sample lies in the number of observations each one includes. A population includes all the elements from a set of data, while a sample consists of one or more observations drawn from the population.
Another difference lies in the practicality and feasibility of studying each one. It’s often impossible or impractical to study an entire population due to cost, time, or logistical constraints. In such cases, we select a sample, which is a more manageable and cost-effective way to gather data and make inferences about the population.
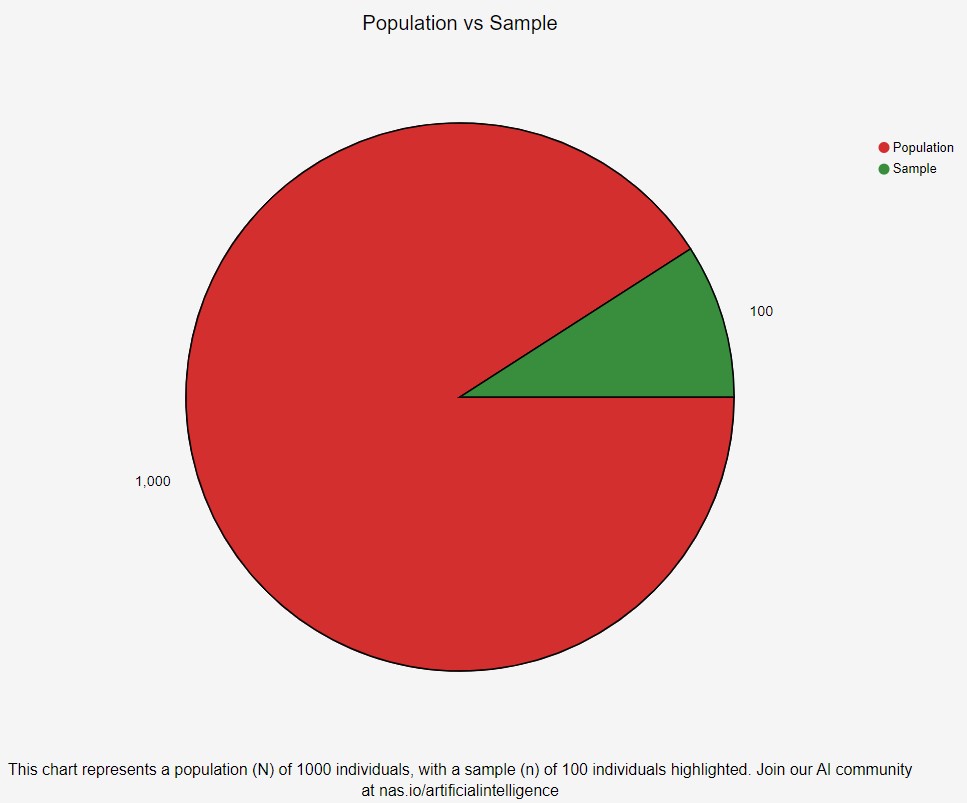
Visualizing Population and Sample: A Snapshot
To help visualize the concepts of population and sample, let’s use the example of doctors in a hospital.

The first histogram represents the ages of all doctors in a hospital. This is our “population”. Each bar represents the frequency of doctors falling within a particular age group.

The second histogram represents a subset of this population — our “sample”. It shows the ages of a randomly selected group of doctors from the hospital. Each bar represents the frequency of doctors in the sample within a particular age group.
These diagrams highlight the fact that while a sample is a smaller group within the population, it can still effectively reflect the characteristics of the overall population if it’s selected properly.
Wrapping Up
Remember, the goal of sampling is to draw conclusions about the population based on the observations made on the sample. Therefore, it’s vital that your sample accurately represents your population. By understanding the difference between population and sample, you can make more informed decisions when conducting your statistical analyses.
Stay tuned for more articles that break down complex statistical concepts into digestible insights. Whether you’re a seasoned data analyst or just getting started in the field, we’re here to help you navigate the world of statistics.
If you want to learn more about statistical analysis, including central tendency measures, check out our comprehensive statistical course. Our course provides a hands-on learning experience that covers all the essential statistical concepts and tools, empowering you to analyze complex data with confidence. With practical examples and interactive exercises, you’ll gain the skills you need to succeed in your statistical analysis endeavors. Enroll now and take your statistical knowledge to the next level!
If you’re looking to jumpstart your career as a data analyst, consider enrolling in our comprehensive Data Analyst Bootcamp with Internship program. Our program provides you with the skills and experience necessary to succeed in today’s data-driven world. You’ll learn the fundamentals of statistical analysis, as well as how to use tools such as SQL, Python, Excel, and PowerBI to analyze and visualize data designed by Mohammad Arshad, 18 years of Data Science & AI Experience. But that’s not all – our program also includes a 3-month internship with us where you can showcase your Capstone Project.
Are you passionate about AI and Data Science? Looking to connect with like-minded individuals, learn new concepts, and apply them in real-world situations? Join our growing AI community today! We provide a platform where you can engage in insightful discussions, share resources, collaborate on projects, and learn from experts in the field.
Don’t miss out on this opportunity to broaden your horizons and sharpen your skills. Visit https://nas.io/artificialintelligence and be part of our AI community. We can’t wait to see what you’ll bring to the table. Let’s shape the future of AI together!
About Community Owner: Mohammad Arshad, A Globally recognized expert in AI
With 18+ years of experience, Mohammad Arshad has successfully enabled businesses to monetize their data and AI products. His technical and strategic expertise has helped 5 of the largest companies in the world, 10 SMEs, and 3 startups build effective Data and AI Strategies.
He founded Decoding Data Science in 2020, a successful AI Strategy consulting practice, and expanded into education in 2022 with the launch of DDS Academy.
Accenture, HP, Dell, LinkedIn, MAF, and other leading companies have recognized Mohammad as a Data Science and Strategy expert since 2005.
Mohammad Arshad has been teaching technical and non-technical audiences since 2008, making him a seasoned mentor and coach in the industry. He has helped 600+ individuals get their Dream jobs.
Pretty section of content. I just stumbled upon your blog and in accession capital to assert that I get in fact enjoyed account your blog posts. Anyway I will be subscribing to your augment and even I achievement you access consistently rapidly.