Introduction to Linear Regression
Linear regression is one of the most fundamental and widely used techniques in machine learning and statistics. It is used to model the relationship between a dependent variable (target) and one or more independent variables (predictors).
In this article, we will cover:
- What is linear regression?
- Types of linear regression
- Assumptions of linear regression
- Implementing linear regression in Python
- Evaluating model performance
- Real-world use cases of linear regression
Let’s get started!
What is Linear Regression?
Linear regression is a supervised learning algorithm used for predictive modeling. It estimates the relationship between dependent and independent variables by fitting a straight line.
The equation for a simple linear regression model (with one independent variable) is:
y=mx+cy = mx + c
Where:
- y = Dependent variable (target output)
- m = Slope of the line (coefficient)
- x = Independent variable (input feature)
- c = Intercept (constant term)
For multiple linear regression (with multiple independent variables), the equation becomes:
y=b0+b1x1+b2x2+…+bnxny = b_0 + b_1x_1 + b_2x_2 + … + b_nx_n
Where:
- b_0 = Intercept
- b_1, b_2, …, b_n = Coefficients of independent variables
- x_1, x_2, …, x_n = Independent variables
Types of Linear Regression
1. Simple Linear Regression
Simple linear regression models the relationship between two variables by fitting a straight line. It is useful for scenarios such as predicting sales based on advertising spend or estimating a person’s weight based on height.
2. Multiple Linear Regression
Multiple linear regression extends simple linear regression by using two or more independent variables to predict the dependent variable. It is often applied in fields like real estate, where house prices are estimated based on multiple factors such as location, square footage, and number of bedrooms.
3. Polynomial Regression
Polynomial regression captures non-linear relationships by fitting a polynomial equation to the data. It is commonly used in financial modeling and scientific research, where relationships between variables are not strictly linear.
4. Ridge Regression
Ridge regression is a regularized version of linear regression that includes a penalty term to prevent overfitting. It is widely used when dealing with multicollinearity in high-dimensional datasets, such as gene expression analysis in bioinformatics.
5. Lasso Regression
Lasso regression (Least Absolute Shrinkage and Selection Operator) performs feature selection by shrinking some coefficients to zero. This makes it useful in predictive modeling for selecting the most significant variables, particularly in applications like customer segmentation and risk assessment.
Assumptions of Linear Regression
Before applying linear regression, certain assumptions must be met:
- Linearity – The relationship between the independent and dependent variables should be linear.
- Independence – Observations should be independent of each other.
- Homoscedasticity – Constant variance of residuals.
- Normality – Residuals should be normally distributed.
- No Multicollinearity – Independent variables should not be highly correlated.
If these assumptions are violated, the model’s performance may be compromised.
Implementing Linear Regression in Python
Let’s implement simple linear regression using Python and the scikit-learn library.
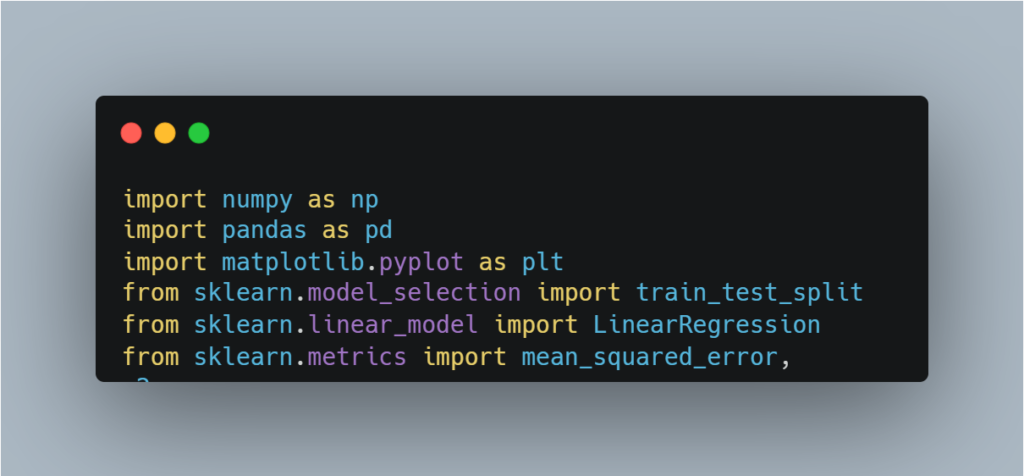
Step 1: Importing Required Libraries
Step 2: Creating a Sample Dataset
# Generate random data
np.random.seed(42)
X = np.random.rand(100, 1) * 10  # Independent variable
Y = 2.5 * X + np.random.randn(100, 1) * 2  # Dependent variable with noise

# Convert to DataFrame
data = pd.DataFrame({'X': X.flatten(), 'Y': Y.flatten()})
data.head()
Step 3: Splitting Data into Train and Test Sets
X_train, X_test, Y_train, Y_test = train_test_split(X, Y, test_size=0.2, random_state=42)
Step 4: Training the Linear Regression Model
# Initialize model
model = LinearRegression()

# Train model
model.fit(X_train, Y_train)
Step 5: Making Predictions
Y_pred = model.predict(X_test)
Step 6: Evaluating Model Performance
mse = mean_squared_error(Y_test, Y_pred)
r2 = r2_score(Y_test, Y_pred)

print(f'Mean Squared Error: {mse:.2f}')
print(f'R-squared Score: {r2:.2f}')
Step 7: Visualizing the Regression Line
plt.scatter(X_test, Y_test, color='blue', label='Actual Data')
plt.plot(X_test, Y_pred, color='red', linewidth=2, label='Regression Line')
plt.xlabel('X')
plt.ylabel('Y')
plt.legend()
plt.title('Linear Regression Fit')
plt.show()
Real-World Use Cases of Linear Regression
1️⃣ Sales Forecasting
Linear regression is extensively used in sales and marketing to predict future revenue based on past sales data. By analyzing historical sales figures and external factors such as advertising spend, promotions, and seasonality, businesses can create models to forecast future demand and optimize inventory management.
2️⃣ Real Estate Price Prediction
In the real estate industry, multiple linear regression is commonly used to estimate property prices. By considering factors like location, square footage, number of bedrooms, and nearby amenities, real estate companies and investors can make data-driven pricing decisions.
3️⃣ Healthcare & Medical Research
Linear regression plays a crucial role in healthcare analytics. It is used to predict disease risk factors, estimate patient recovery time, and analyze the effectiveness of treatments based on historical patient data. Hospitals and pharmaceutical companies rely on regression models to improve patient care and resource allocation.
4️⃣ Stock Market Analysis
Financial analysts use linear regression to evaluate stock prices and market trends. By analyzing historical price movements, economic indicators, and company financials, traders can build models that help in making informed investment decisions.
5️⃣ Manufacturing & Quality Control
Manufacturers leverage regression models to detect defects and optimize production processes. By analyzing variables like machine temperature, production time, and material quality, factories can minimize errors and improve product consistency.
6️⃣ Marketing & Advertising
Marketers use linear regression to analyze the impact of advertising campaigns on sales performance. By examining data from multiple channels such as social media, email marketing, and TV ads, businesses can determine the most effective strategies for maximizing return on investment (ROI).
7️⃣ Education & Student Performance
Educational institutions use regression models to understand student performance trends. Factors like study hours, attendance, parental education level, and extracurricular activities can be analyzed to identify key drivers of academic success and recommend targeted interventions.
FAQs on Linear Regression
1️⃣ When should I use linear regression?
Linear regression is best used when there is a clear linear relationship between the independent and dependent variables. It is ideal for scenarios where interpretability is important, such as predicting sales, prices, and customer trends.
2️⃣ How do I check if my data is suitable for linear regression?
You can check for linearity using scatter plots, residual plots, and correlation coefficients. Additionally, checking for multicollinearity using variance inflation factor (VIF) and ensuring that residuals are normally distributed will confirm suitability.
3️⃣ Can I use linear regression for classification?
No, linear regression is meant for continuous output prediction. For classification problems (e.g., predicting whether a customer will buy a product or not), logistic regression is a better alternative.
4️⃣ How does multicollinearity affect linear regression?
Multicollinearity occurs when independent variables are highly correlated, making it difficult for the model to determine the impact of each variable. It can lead to unstable coefficients and misleading interpretations. Techniques like Ridge or Lasso regression can help mitigate this issue.
5️⃣ What are some alternatives to linear regression for more complex problems?
If your data has a non-linear relationship, consider using polynomial regression, decision trees, support vector machines (SVM), or neural networks. For large datasets with high-dimensional features, ensemble methods like Random Forest and XGBoost may be more effective.
6️⃣ How do I handle outliers in linear regression?
Outliers can distort the regression model and reduce accuracy. You can identify outliers using box plots or Z-scores and handle them by transforming the data, removing extreme values, or using robust regression techniques like RANSAC.
7️⃣ What is the difference between Ridge and Lasso regression?
Both Ridge and Lasso regression are regularization techniques used to prevent overfitting. Ridge regression adds an L2 penalty that shrinks all coefficients, while Lasso regression adds an L1 penalty that can shrink some coefficients to zero, effectively performing feature selection.
8️⃣ How can I improve the accuracy of a linear regression model?
- Use feature selection to remove irrelevant variables.
- Apply transformations like log or polynomial features for non-linear data.
- Use cross-validation to assess model performance.
- Normalize or standardize the data to improve convergence.
Conclusion
Linear regression is a powerful yet simple technique used for predictive modeling in data science. While effective for linear relationships, it has limitations when handling complex patterns. Understanding its assumptions, implementation, and evaluation is crucial for building accurate models.
Would you like to explore multiple linear regression or advanced regression techniques next? Let us know in the comments!
This guide provides a complete beginner-friendly tutorial on linear regression with Python. If you found this helpful, share it with your network! 🚀
If you’re looking to jumpstart your career as a Data Scientist, consider enrolling in our comprehensive AI Residency Program Our program provides you with the skills and experience necessary to succeed in today’s data-driven world. You’ll learn the fundamentals of statistical analysis, as well as how to use tools such as SQL, Python, Excel, and PowerBI to analyze and visualize data designed by Mohammad Arshad, 19 years of Data Science & AI Experience. But that’s not all – our program also includes a 3-month internship with us where you can showcase your Capstone Project.
Are you passionate about AI and Data Science? Looking to connect with like-minded individuals, learn new concepts, and apply them in real-world situations? Join our growing AI community today! We provide a platform where you can engage in insightful discussions, share resources, collaborate on projects, and learn from experts in the field.
Don’t miss out on this opportunity to broaden your horizons and sharpen your skills. Visit https://decodingdatascience.com/ai and be part of our AI community. We can’t wait to see what you’ll bring to the table. Let’s shape the future of AI together!
great