As a statistical method used to analyze data, ANOVA (Analysis of Variance) is one of the most widely used statistical techniques for comparing the means of two or more groups. In this article, we will delve deeper into the basics of ANOVA, its types, assumptions, and practical applications.
What is ANOVA?
ANOVA is a statistical method that is used to compare means between two or more groups. It does this by breaking down the total variance present in the data into two components: variance due to differences between groups and variance due to differences within groups. In essence, ANOVA is a way of testing whether the means of two or more groups are significantly different from each other.
Types of ANOVA
There are several types of ANOVA, each with its own specific use case. The most commonly used types of ANOVA include:
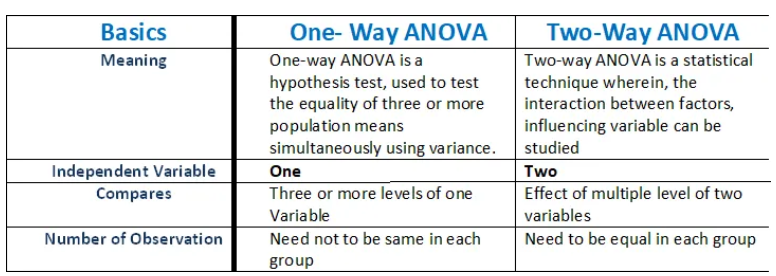
One-way ANOVA
One-way ANOVA is used to compare the means of two or more groups that are independent of each other. This type of ANOVA assumes that the samples are randomly selected and that the variances of the populations from which the samples are drawn are equal.
Two-way ANOVA
Two-way ANOVA is used to compare the means of two or more groups that are related to each other in some way. For example, it could be used to compare the means of two different drug treatments on patients of different ages. This type of ANOVA assumes that the samples are randomly selected and that the variances of the populations from which the samples are drawn are equal.
MANOVA
MANOVA (Multivariate Analysis of Variance) is used when there are two or more dependent variables that need to be analyzed simultaneously. It is used to test whether the mean vectors of the dependent variables are significantly different across the groups.
Assumptions of ANOVA
ANOVA is a powerful statistical tool, but it is also subject to several assumptions that must be met in order for it to be valid. These assumptions include:
Independence
The observations in each group must be independent of each other. This means that the outcome of one observation should not be influenced by the outcome of any other observation in the same group.
Normality
The distribution of each group should be approximately normal. This means that the mean and standard deviation of each group should be approximately the same.
Homoscedasticity
The variance of each group should be approximately the same. This means that the spread of each group should be approximately the same.
Sample size
The sample size of each group should be approximately the same. This means that each group should have a similar number of observations.
Practical Applications of ANOVA
ANOVA is used in many fields, including science, engineering, medicine, and social sciences. Some of the most common applications of ANOVA include:
Medical research
ANOVA is used to compare the effectiveness of different treatments or interventions in medical research.
Quality control
ANOVA is used in manufacturing to compare the quality of different products or production processes.
Marketing research
ANOVA is used in marketing to compare the effectiveness of different advertising campaigns or promotional strategies.
Education research
ANOVA is used in education research to compare the effectiveness of different teaching methods or curriculums.
Conclusion
In conclusion, ANOVA is a powerful statistical technique that is used to analyze the differences between multiple groups or conditions. It is widely used in many fields, including medicine, psychology, and engineering. By analyzing the sources of variation between and within groups, ANOVA can provide valuable insights into the factors that influence the outcome of an experiment.
However, it is important to keep in mind the assumptions of ANOVA and the limitations of the technique. Violations of the assumptions, such as non-normality or heteroscedasticity, can lead to invalid results. Additionally, ANOVA only provides information about whether there are significant differences between groups, but not which specific groups are different from each other. Finally, ANOVA is a parametric test that requires numerical data, so it may not be appropriate for all types of data.
Overall, ANOVA is a useful tool for analyzing differences between groups and can provide valuable insights into experimental data. By understanding the assumptions and limitations of ANOVA, researchers can use this technique to draw meaningful conclusions from their data.
If you want to learn more about statistical analysis, including central tendency measures, check out our comprehensive statistical course. Our course provides a hands-on learning experience that covers all the essential statistical concepts and tools, empowering you to analyze complex data with confidence. With practical examples and interactive exercises, you’ll gain the skills you need to succeed in your statistical analysis endeavors. Enroll now and take your statistical knowledge to the next level!
If you’re looking to jumpstart your career as a data analyst, consider enrolling in our comprehensive Data Analyst Bootcamp with Internship program. Our program provides you with the skills and experience necessary to succeed in today’s data-driven world. You’ll learn the fundamentals of statistical analysis, as well as how to use tools such as SQL, Python, Excel, and PowerBI to analyze and visualize data. But that’s not all – our program also includes a 3-month internship with us where you can showcase your Capstone Project.
You really make it appear really easy with your presentation however I find this topic to be actually something which I feel I’d never understand. It seems too complicated and very large for me. I am having a look forward for your next post, I¦ll try to get the grasp of it!
Everything is very open and very clear explanation of issues. was truly information. Your website is very useful. Thanks for sharing.
Real superb visual appeal on this site, I’d value it 10 10.
My brother recommended I might like this website. He used to be entirely right. This publish actually made my day. You can not believe just how much time I had spent for this info! Thanks!