1. Introduction
A probability distribution represents the possible outcomes of a statistical experiment and the likelihood of each outcome occurring. It’s a foundational concept in statistics and provides insights into the patterns and behaviors of random variables.
2. Types of Probability Distributions
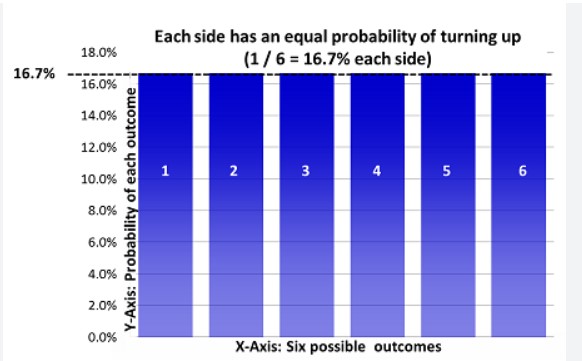
a. Discrete Probability Distribution
Example: Uniform Distribution (Rolling a fair die)
- Each face of the die has an equal probability of 1/6
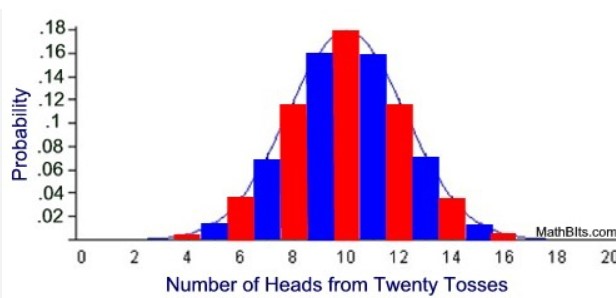
Example: Binomial Distribution (Flipping a coin)
- If you flip a fair coin 20 times, the number of “heads” follows a binomial distribution with
trials and probability of success.
b. Continuous Probability Distribution
Example: Uniform Distribution (Selecting a random number)
- Choosing a number between 0 and 1, where all numbers have an equal chance of being chosen.
Example: Normal Distribution (Heights of people)
- The heights of adult males in a population, if normally distributed, describe the variability of heights.
3. Key Concepts Explained with Examples
a. Probability Mass Function (PMF)
- Discrete Variables
- Example: The probability of rolling a specific number on a fair six-sided die. Each outcome has a probability of 1/6
b. Probability Density Function (PDF)
- Continuous Variables
- Example: The distribution of heights in a population, where the PDF shows the relative likelihood of different heights.
c. Cumulative Distribution Function (CDF)
- Example: The probability that a person chosen at random is below a certain height.
4. Conclusion
Understanding probability distributions is essential for interpreting and predicting real-world phenomena. From the roll of a die to the height of individuals in a population, probability distributions offer a structured way to analyze randomness and variability.
By recognizing different types of distributions and how they function, beginners can gain a strong foundation in statistical reasoning and data analysis.
For further study, consider exploring more complex distributions and applying them to real-world scenarios, or engaging with interactive tools and simulations to deepen your understanding.
If you want to learn more about statistical analysis, including central tendency measures, check out our comprehensive statistical course. Our course provides a hands-on learning experience that covers all the essential statistical concepts and tools, empowering you to analyze complex data with confidence. With practical examples and interactive exercises, you’ll gain the skills you need to succeed in your statistical analysis endeavors. Enroll now and take your statistical knowledge to the next level!
If you’re looking to jumpstart your career as a data analyst, consider enrolling in our comprehensive Data Analyst Bootcamp with Internship program. Our program provides you with the skills and experience necessary to succeed in today’s data-driven world. You’ll learn the fundamentals of statistical analysis, as well as how to use tools such as SQL, Python, Excel, and PowerBI to analyze and visualize data designed by Mohammad Arshad, 18 years of Data Science & AI Experience. But that’s not all – our program also includes a 3-month internship with us where you can showcase your Capstone Project.
Are you passionate about AI and Data Science? Looking to connect with like-minded individuals, learn new concepts, and apply them in real-world situations? Join our growing AI community today! We provide a platform where you can engage in insightful discussions, share resources, collaborate on projects, and learn from experts in the field.
Don’t miss out on this opportunity to broaden your horizons and sharpen your skills. Visit https://nas.io/artificialintelligence and be part of our AI community. We can’t wait to see what you’ll bring to the table. Let’s shape the future of AI together!
I was very pleased to find this web-site.I wanted to thanks for your time for this wonderful read!! I definitely enjoying every little bit of it and I have you bookmarked to check out new stuff you blog post.