When we think of data, we often think of it in terms of its central tendency – the average or median value that represents the “typical” value of a dataset. But central tendency only tells us part of the story. What about the other values in the dataset? How spread out are they? How much variability is there?
This is where measures of spread come in. Measures of spread are statistical tools that allow us to quantify the variability or dispersion of data. In this article, we will explore different types of measures of spread, how they are calculated, and how they can be used in data analysis.
What is Variability?
Before we dive into measures of spread, let’s first define what we mean by variability. In statistics, variability refers to the degree to which individual data points deviate from the central tendency. In other words, it measures how much the data “varies” or spreads out.
Variability is an important concept in statistics because it tells us how much we can trust the central tendency as a representation of the data. If there is a lot of variability, the central tendency may not be a good representation of the data.
Types of Measures of Spread
There are several types of measures of spread, each with its own strengths and weaknesses. Here are some of the most common ones:
Range
The range is the simplest measure of spread and is calculated by subtracting the smallest value from the largest value in a dataset. While easy to calculate, the range is sensitive to outliers and may not be representative of the variability of the majority of the data. More details in a separate Article.
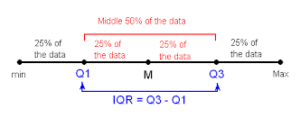
Interquartile Range (IQR)
The interquartile range is a more robust measure of spread that is less sensitive to outliers. It is calculated by subtracting the 25th percentile (Q1) from the 75th percentile (Q3) of the dataset. The IQR represents the range of the middle 50% of the data. More details in a separate Article.
Standard Deviation
The standard deviation is a widely used measure of spread that takes into account the distance of each data point from the mean. It is calculated by taking the square root of the variance, which is the average of the squared deviations from the mean. The standard deviation is sensitive to outliers, but less so than the range. More details in a separate Article.
Variance
The variance is similar to the standard deviation in that it measures the spread of data around the mean. However, it is calculated by taking the average of the squared deviations from the mean, rather than the square root of that average. The variance is more sensitive to outliers than the standard deviation. More details in a separate Article.
How Measures of Spread are Used
Measures of spread are used in a variety of ways in data analysis. Here are some examples:
Identifying Outliers
Outliers are data points that are significantly different from the rest of the data. Measures of spread can be used to identify outliers by highlighting values that fall outside a certain range.
Comparing Datasets
Measures of spread can be used to compare the variability of different datasets. For example, if we want to compare the variability of test scores in two different schools, we can use measures of spread to see which school has more consistent scores.
Estimating Confidence Intervals
Measures of spread can be used to calculate confidence intervals, which are ranges of values that are likely to contain the true population parameter. The width of the confidence interval is determined by the level of variability in the data.
Conclusion
Measures of spread are essential tools in data analysis that allow us to understand the variability of data. By quantifying the spread of data, we can make more informed decisions and draw more accurate conclusions. Whether we are identifying outliers, comparing datasets, or estimating confidence intervals,
If you want to learn more about statistical analysis, including central tendency measures, check out our comprehensive statistical course. Our course provides a hands-on learning experience that covers all the essential statistical concepts and tools, empowering you to analyze complex data with confidence. With practical examples and interactive exercises, you’ll gain the skills you need to succeed in your statistical analysis endeavors. Enroll now and take your statistical knowledge to the next level!
If you’re looking to jumpstart your career as a data analyst, consider enrolling in our comprehensive Data Analyst Bootcamp with Internship program. Our program provides you with the skills and experience necessary to succeed in today’s data-driven world. You’ll learn the fundamentals of statistical analysis, as well as how to use tools such as SQL, Python, Excel, and PowerBI to analyze and visualize data. But that’s not all – our program also includes a 3-month internship with us where you can showcase your Capstone Project.
Great line up. We will be linking to this great article on our site. Keep up the good writing.
impressive content!