As we go through life, we often encounter situations that involve statistics. Whether it’s calculating a batting average, determining the probability of winning the lottery, or figuring out how many people in a population have a particular disease, statistics play a critical role in our lives. One of the most useful concepts in statistics is the Empirical Rule, also known as the Three Sigma Rule. This rule is essential for understanding how data is distributed and what we can infer from that distribution. In this article, we will explain what the Empirical Rule is, how it works, and why it’s important.
The Empirical Rule, also known as the Three Sigma Rule, is a statistical concept that helps us understand how data is distributed. It is based on the normal distribution, which is a bell-shaped curve that describes the distribution of many natural phenomena, such as heights, weights, and IQ scores. The Empirical Rule tells us what percentage of data falls within a certain number of standard deviations from the mean of the distribution. This rule is essential for understanding statistical inference, which is the process of making predictions and drawing conclusions from data.
2. What is the Empirical Rule?
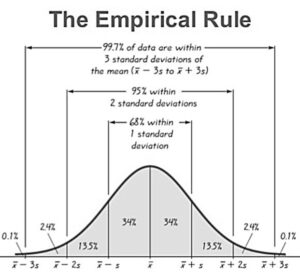
The Empirical Rule is a statistical concept that states that for a normal distribution, approximately 68% of the data falls within one standard deviation of the mean, approximately 95% of the data falls within two standard deviations of the mean, and approximately 99.7% of the data falls within three standard deviations of the mean. This rule is also known as the Three Sigma Rule, where “sigma” is the Greek letter that represents standard deviation.
3. The Normal Distribution
Before we can understand the Empirical Rule, we need to understand the normal distribution. The normal distribution is a probability distribution that is symmetrical and bell-shaped. It is described by two parameters: the mean and the standard deviation. The mean is the average value of the distribution, and the standard deviation is a measure of how spread out the data is. In a normal distribution, the mean and the median are the same, and the majority of the data falls within one or two standard deviations of the mean.
4. The Three Sigma Rule
The Empirical Rule tells us that approximately 68% of the data falls within one standard deviation of the mean, approximately 95% of the data falls within two standard deviations of the mean, and approximately 99.7% of the data falls within three standard deviations of the mean. This means that if we have a normal distribution, we can use the Empirical Rule to estimate what percentage of the data falls within a certain range.
5. Calculating the Empirical Rule
To calculate the Empirical Rule, we first need to find the mean and the standard deviation of our data. Once we have these values, we can use the formula to estimate the percentage of data that falls
within a certain range. For example, if the mean is 50 and the standard deviation is 10, we can use the Empirical Rule to estimate what percentage of the data falls between 30 and 70.
6. Interpretation of the Empirical Rule
The Empirical Rule is a powerful tool that can help us understand how data is distributed. It tells us that for a normal distribution, most of the data falls within a certain range, and only a small percentage falls outside that range. This can be useful in many different fields, such as finance, quality control, and scientific research.
7. Importance of the Empirical Rule
The Empirical Rule is important because it provides a quick and easy way to estimate the distribution of data. This can be useful in many different fields, such as finance, quality control, and scientific research. For example, if we are studying the effectiveness of a new medication, we can use the Empirical Rule to estimate the percentage of patients who are likely to respond to the medication. This can help us make informed decisions about how to proceed with our research.
8. Limitations of the Empirical Rule
While the Empirical Rule is a powerful tool, it does have some limitations. First, it only applies to normal distributions. If our data is not normally distributed, we cannot use the Empirical Rule to estimate the distribution of data. Second, the Empirical Rule is only an estimate. While it can give us a good idea of what percentage of data falls within a certain range, it cannot tell us exactly how the data is distributed. Finally, the Empirical Rule assumes that our data is independent and identically distributed. If our data violates these assumptions, the Empirical Rule may not be applicable.
9. Conclusion
The Empirical Rule, also known as the Three Sigma Rule, is a powerful tool that can help us understand how data is distributed. It tells us what percentage of data falls within a certain range for a normal distribution. This can be useful in many different fields, such as finance, quality control, and scientific research. However, it does have some limitations, such as only applying to normal distributions and being an estimate rather than an exact calculation.
If you want to learn more about statistical analysis, including central tendency measures, check out our comprehensive statistical course. Our course provides a hands-on learning experience that covers all the essential statistical concepts and tools, empowering you to analyze complex data with confidence. With practical examples and interactive exercises, you’ll gain the skills you need to succeed in your statistical analysis endeavors. Enroll now and take your statistical knowledge to the next level!
If you’re looking to jumpstart your career as a data analyst, consider enrolling in our comprehensive Data Analyst Bootcamp with Internship program. Our program provides you with the skills and experience necessary to succeed in today’s data-driven world. You’ll learn the fundamentals of statistical analysis, as well as how to use tools such as SQL, Python, Excel, and PowerBI to analyze and visualize data designed by Mohammad Arshad, 18 years of Data Science & AI Experience. But that’s not all – our program also includes a 3-month internship with us where you can showcase your Capstone Project.
I really appreciate this post. I¦ve been looking all over for this! Thank goodness I found it on Bing. You’ve made my day! Thx again
Thanks also join the community https://nas.io/artificialintelligence
Saved as a favorite, I really like your blog!
Thanks also join the community https://nas.io/artificialintelligence