When making decisions or conducting research, it is essential to determine the reliability of the results. One way to do this is through the use of confidence intervals. Confidence intervals provide an estimate of the range within which a population parameter, such as the mean or proportion, is likely to lie. In this article, we will explore the concept of confidence intervals, how they are calculated, and their importance in statistical analysis.
What is a Confidence Interval?
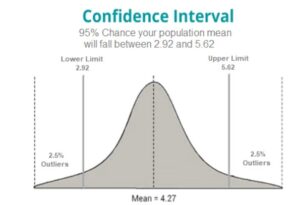
A confidence interval is a range of values that is likely to contain the true population parameter with a certain degree of confidence. For example, if we are interested in the population mean, we can calculate a confidence interval that provides an estimate of the range within which the true population mean is likely to lie. The confidence level is the probability that the interval contains the true population parameter.
How are Confidence Intervals Calculated?
Confidence intervals are calculated using a sample from the population. The sample mean and standard deviation are used to estimate the population mean and standard deviation. The formula for calculating a confidence interval depends on the type of data and the distribution of the population.
For example, if we have a sample of normally distributed data, we can use the following formula to calculate a confidence interval for the population mean:
Confidence Interval = Sample Mean ± (Critical Value) × (Standard Error)
The critical value is determined by the confidence level and the sample size. The standard error is a measure of the variability of the sample mean.
What is the Importance of Confidence Intervals?
Confidence intervals are important because they provide a measure of the precision of our estimate. A wider confidence interval indicates greater uncertainty in our estimate, while a narrower interval indicates greater precision.
Confidence intervals also allow us to test hypotheses and make inferences about the population. If the null hypothesis is that the population parameter is equal to a certain value, we can use a confidence interval to determine whether or not this value falls within the range of the interval. If it does not, we can reject the null hypothesis and conclude that the population parameter is different from the assumed value.
What are the Limitations of Confidence Intervals?
Confidence intervals have several limitations that must be considered. First, they only provide an estimate of the range within which the true population parameter is likely to lie. They do not guarantee that the true parameter falls within this range.
Second, confidence intervals are based on assumptions about the distribution of the population. If these assumptions are not met, the confidence interval may not be accurate.
Finally, confidence intervals are affected by sample size. Larger samples generally result in narrower intervals and greater precision.
How to Interpret Confidence Intervals?
Confidence intervals should be interpreted in the context of the research question and the data. If the interval is very wide, it indicates that there is a lot of uncertainty in the estimate. If the interval does not include a certain value, it indicates that this value is unlikely to be the true population parameter.
It is also important to consider the confidence level when interpreting confidence intervals. A higher confidence level indicates greater certainty, but also results in wider intervals.
Conclusion
Confidence intervals are a valuable tool for estimating population parameters and testing hypotheses. They provide a measure of the precision of our estimate and allow us to make inferences about the population. However, they are also subject to limitations and should be interpreted in the context of the research question and the data.
FAQs
-
- What is the difference between a confidence interval and a prediction interval? A confidence interval provides an estimate of the range within which the population parameter is likely to lie. A prediction interval provides an estimate of the range within which a new observation is likely to fall.
- What is the significance level in a confidence interval? The significance level is the probabilityThe significance level is the probability of rejecting the null hypothesis when it is actually true. It is often set to 0.05, which corresponds to a 95% confidence level.
- How do you choose the confidence level for a confidence interval? The choice of confidence level depends on the level of certainty required for the research question. A higher confidence level, such as 99%, provides greater certainty but also results in wider intervals.
- Can confidence intervals be used for non-parametric data? Confidence intervals are based on assumptions about the distribution of the population, so they may not be appropriate for non-parametric data. In this case, alternative methods, such as bootstrapping, may be used.
- Are confidence intervals the same as margins of error? Margins of error are a type of confidence interval that are used in surveys to estimate the range within which the true population parameter is likely to lie. However, margins of error are often based on assumptions about the sampling method and the population, so they may not always be accurate.
If you want to learn more about statistical analysis, including central tendency measures, check out our comprehensive statistical course. Our course provides a hands-on learning experience that covers all the essential statistical concepts and tools, empowering you to analyze complex data with confidence. With practical examples and interactive exercises, you’ll gain the skills you need to succeed in your statistical analysis endeavors. Enroll now and take your statistical knowledge to the next level!
If you’re looking to jumpstart your career as a data analyst, consider enrolling in our comprehensive Data Analyst Bootcamp with Internship program. Our program provides you with the skills and experience necessary to succeed in today’s data-driven world. You’ll learn the fundamentals of statistical analysis, as well as how to use tools such as SQL, Python, Excel, and PowerBI to analyze and visualize data. But that’s not all – our program also includes a 3-month internship with us where you can showcase your Capstone Project.
I am constantly thought about this, regards for putting up.