In statistical analysis, central tendency measures are used to summarize a dataset by providing a representative value that is easily understood. These measures are essential in drawing meaningful conclusions from complex data. For example, a company may use central tendency measures to understand the average sales of a product, or a doctor may use these measures to determine the average age of patients with a particular medical condition.
What is Central Tendency?
Central tendency refers to the value that is most representative of a dataset. This value is typically located near the center of the data, and it is used to summarize the dataset in a single value. There are three common measures of central tendency: mean, median, and mode.
In addition to central tendency, outliers are an essential consideration when analyzing data. An outlier is a value that is significantly different from other values in the dataset. Outliers can impact central tendency measures and should be identified and handled appropriately.
Mean
Mean is the most common measure of central tendency. It is the arithmetic average of a dataset, calculated by adding all the values and dividing by the number of values. Mean is sensitive to outliers, as a single outlier can significantly impact the average.
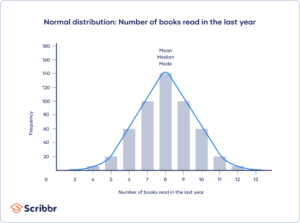
Mean is most appropriate for datasets that are symmetrical and normally distributed. For example, the mean is useful in analyzing the average height of a group of people or the average temperature over a month.
Median
The median is the middle value in a dataset, with half the values above and half below it. It is less sensitive to outliers than mean, making it more appropriate for datasets that are skewed.
For example, if we analyze the income of a group of people, the median is a more appropriate measure than the mean because a few high earners can skew the average income upwards. In such cases, the median provides a more accurate representation of the income distribution.
Mode
The mode is the value that occurs most frequently in a dataset. Unlike mean and median, mode can be used for both numerical and categorical data.
For example, the mode is useful in analyzing the most common color of cars sold in a particular region. The mode can also be used in datasets with multiple modes, where there is no single representative value.
Comparing Mean, Median, and Mode
The choice of which central tendency measure to use depends on the nature of the data being analyzed. Mean is most appropriate for symmetrical and normally distributed datasets, median is more appropriate for skewed datasets, and mode is useful for categorical and non-numerical data.
It is essential to consider outliers when choosing a measure of central tendency. Outliers can significantly impact the mean, while the median and mode are less sensitive to outliers.
Conclusion
Central tendency measures are essential in summarizing and analyzing data. Mean, median, and mode provide a single representative value that is easily understood. The choice of which measure to use depends on the nature of the data and the presence of outliers. By understanding these measures’ differences, analysts can draw meaningful conclusions from complex data.
If you want to learn more about statistical analysis, including central tendency measures, check out our comprehensive statistical course. Our course provides a hands-on learning experience that covers all the essential statistical concepts and tools, empowering you to analyze complex data with confidence. With practical examples and interactive exercises, you’ll gain the skills you need to succeed in your statistical analysis endeavors. Enroll now and take your statistical knowledge to the next level!
If you’re looking to jumpstart your career as a data analyst, consider enrolling in our comprehensive Data Analyst Bootcamp with Internship program. Our program provides you with the skills and experience necessary to succeed in today’s data-driven world. You’ll learn the fundamentals of statistical analysis, as well as how to use tools such as SQL, Python, Excel, and PowerBI to analyze and visualize data. But that’s not all – our program also includes a 3-month internship with us where you can showcase your Capstone Project.
Woah! I’m really digging the template/theme of this blog. It’s simple, yet effective. A lot of times it’s difficult to get that “perfect balance” between usability and appearance. I must say you’ve done a amazing job with this. In addition, the blog loads extremely quick for me on Firefox. Excellent Blog!
Impressive content!